Analysis of Anki flashcards usage
Posted on Wed 17 June 2020 in posts
In this post I'll briefly introduce Anki flashcards, show an analysis of my usage over time and give instructions and example python code for how to extract data from Anki's SQLite database and load it into pandas.
An introduction to Anki
About four years ago I discovered spaced repetition learning and the flashcard app Anki. It is not an exaggeration to say that it has revolutionised the way I study.
If you are not aware of spaced repetition learning I highly recommend you check it out. The basic premise is that you format material that you want to learn into flashcards with short questions on one side and short answers on the other side. Anki then tests you on the cards you have made. Questions which you repeatedly get wrong keep returning with high frequency, while questions that you repeatedly get right return less and less frequently.
The app is highly addictive because cards build up in a backlog which you need to try to clear every day. If you don't you have double the work to do the next day... or triple if you leave it three days. If I neglect my cards during a particularly busy week this can result in grueling sessions of several hours over the weekend.
Below is an example anki card, first the question display and below the question and answer display.
When you see the question you say the answer out loud, or on the mobile app there is an option to write the answer on a scratch pad. You then reveal the answer and tell Anki if you got the question wrong or got it right and it was hard, good or easy. If you got it wrong it will come back within the same study session, otherwise it will come back at a later date, in this case in 2, 3 or 4 days depending on how easy you found it. If you also answer correctly for a particular card the next time you see it, the interval of time until you see it again will be even longer (probably around a week in this case).
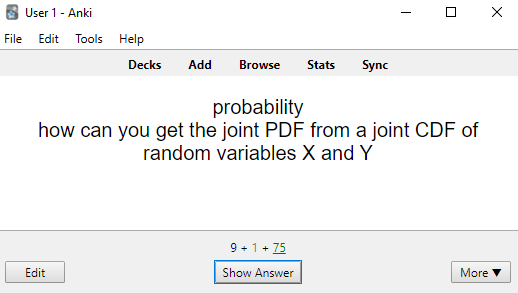
Example Anki card (question)
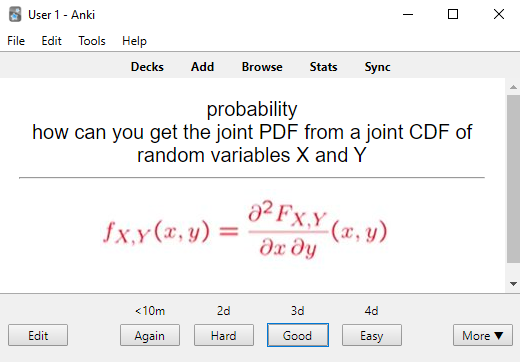
Example Anki card (answer)
My Anki usage over time
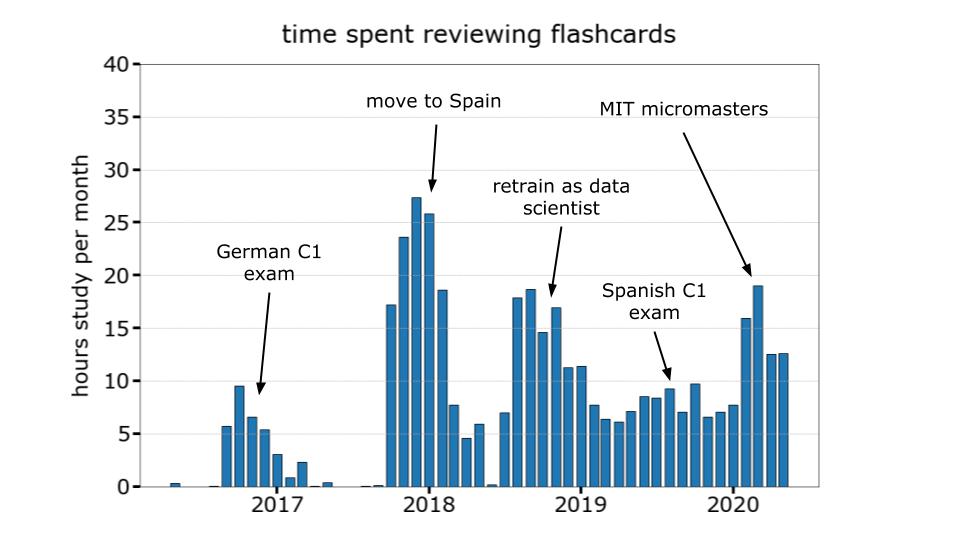
Depending on the period of my life (if I'm learning a new language or taking a course) my usage increases or decreases, so I thought it would be interesting to see how my usage has evolved over time and during which periods I used it the most. Below is a histogram charting my hourly usage per month.
I first really got into Anki when cramming vocabulary for my German C1 exam when I was living in Berlin. After an intensive winter studying I seem to have given myself a spring and summer off from studying while I was working as a tour guide around Europe.
I then moved to Spain and relied heavily on Anki to cram new vocabulary, which I learnt in order of frequency from lists such as that compiled by Gabriel Wyner and the Routledge frequency dictionary of Spanish.
In the second half of 2018 I decided to retrain as a data scientist and studied with flashcards intensively for example to learn the basics of probability as shown in the examples above. I then kept up a fairly steady usage with a small increase when studying for my Spanish C1 and another surge recently because I'm taking the excellent Statistics and Data Science Micromasters course with MITx on edX.
How to load data from Anki into python
The data from Anki decks are stored in an SQLite database. On the Anki desktop application choose the deck you want to analyse, then select settings -> export. The deck will be saved as a .apkg file, which is just a zip file. If you unzip this you will end up with a media folder, which we won't use and a file called collection.anki2, which is the SQLite file we want to access.
The code below shows you how to set up a connection to the sqlite database with the sqlite3 package, extract the review data to a pandas dataframe, format and aggregate the data and finally plot a histogram of monthly time spent reviewing.
import matplotlib.pyplot as plt
import pandas as pd
import sqlite3
from matplotlib.dates import DateFormatter
from pandas.plotting import register_matplotlib_converters
from matplotlib import rcParams
import matplotlib.dates as mdates

# set up sqlite connection
conn = sqlite3.connect("collection.anki2")

# matplotlib settings
rcParams['font.family'] = 'Verdana'
register_matplotlib_converters()

def extract_monthly_review_data(conn):
    '''extract aggregate monthly review data from anki deck'''

    # select review data from anki deck
    df = pd.read_sql_query("SELECT * from revlog;", conn)

    # convert anki id which corresponds to time in milliseconds (10^-3s) since epoch
    # to nanoseconds (10^-9s) since epoch then convert to pandas datetime
    df["dt"] = pd.to_datetime(df["id"]*10**6)

    # group by year and month
    df["year-month"] = df["dt"].dt.year.astype(str) + "-"  + df["dt"].dt.month.astype(str)
    agg_df = df.groupby("year-month")[["time","id"]].agg({"id":"count","time":"sum"})

    # convert cumulative time taken per card in milliseconds to hours
    agg_df["hours"] = agg_df["time"]/(1000*60*60)
    agg_df["dt"] = pd.to_datetime(agg_df.index)
    agg_df.index = agg_df.dt

    return agg_df


def plot_histogram(df):
    '''plot histogram of anki card usage over time'''

    fig,ax = plt.subplots(figsize=(15,10))
    ax.bar(df.index,df["hours"],22,edgecolor="black")
    ax.grid(linestyle='--',axis="y")

    # change tick widths
    for tick in ax.get_xticklabels():
        tick.set_rotation(0)
    ax.xaxis.set_tick_params(width=4,length=10)
    ax.yaxis.set_tick_params(width=4,length=10)

    # Set x tick format
    date_form = DateFormatter("%Y")
    ax.xaxis.set_major_formatter(date_form)
    ax.xaxis.set_major_locator(mdates.YearLocator())
    ax.tick_params(labelsize=30)

    # Labels
    ax.set_title("time spent reviewing flashcards",fontsize=35,pad=30)
    ax.set_ylabel("hours study per month",fontsize=30,labelpad=15)
    ax.set_ylim(0,40)

    fig.tight_layout()
    fig.savefig("review_history.png")

df = extract_monthly_review_data(conn)
plot_histogram(df)